OpenCode Finally Gets OTEL
If you've been following the OpenCode GitHub repository, you've probably noticed a recurring theme: When will OpenTelemetry support actually work?
This question haunted the community for nearly a year. From the first experimental PR in the summer of 2025, to configuration options being added with no output, to community proposals being submitted and shelved repeatedly, to users confusedly asking in Issues "Why can't I see traces even though I configured everything per the docs?" — the road to OTEL integration in OpenCode has been anything but smooth.
It wasn't until April 2026 that things finally turned around. On April 7, a streamlined OTLP export PR was quietly merged; within the following week, core contributor kitlangton submitted 5 fix PRs in succession, filling in the critical gaps: span bridging, context propagation, attribute standardization, and more. "Ten years to sharpen a sword" might be an exaggeration, but after nearly ten months of waiting, there's finally a result.
In this article, I want to trace this journey from the beginning — not just a cold timeline, but the technical reasons behind "why was this so hard," and what you should actually do to integrate now and what you'll get out of it. If you're also using OpenCode, I hope this article helps you avoid the detours.
OTEL Merge Timeline
From the first experimental PR in July 2025 to 6 critical PRs merged within a single week in mid-April 2026, OpenCode's OTEL integration traversed nearly 10 months of twists and turns. Here are the key milestones:
| Date | PR / Issue | Author | Status | Key Content |
|---|---|---|---|---|
| 2025-07 | PR #799 | Schniz | CLOSED | Earliest OTEL addition for performance debugging |
| 2025-08 | PR #1738 | thdxr | MERGED | Removed unused OTEL tracing code |
| 2025-09 | PR #2735 | BrianVandenberg | CLOSED | AI SDK OTEL Instrumentation, lukewarm reception |
| 2025-12-05 | PR #4978 | noamzbr | MERGED | First merged OTEL PR, added experimental.open_telemetry config |
| 2025-12-08 | PR #5245 | tianhuil | OPEN | Complete integration proposal, multiple users confirmed it doesn't work out of the box |
| 2026-01-02 | PR #6629 | Hona (Luke Parker) | OPEN (Draft) | 227 commits, most comprehensive proposal, Aspire Dashboard support |
| 2026-02-13 | Issue #13438 | Community | — | No traces output even with openTelemetry: true enabled |
| 2026-04-07 | PR #21387 | thdxr | MERGED | Breakthrough PR: Effect service layer OTLP export |
| 2026-04-10 | PR #21799 | kitlangton | CLOSED | Global Tracer bridging (superseded by subsequent PRs) |
| 2026-04-15 | PR #22526 | kitlangton | MERGED | Fixed AI SDK telemetry spans export |
| 2026-04-15 | PR #22645 | kitlangton | MERGED | Registered Context Manager, fixed broken span parent-child relationships |
| 2026-04-15 | PR #22653 | kitlangton | MERGED | Request-level route spans |
| 2026-04-17 | PR #23156 | kitlangton | MERGED | Removed low-value spans from streaming event hot path |
| 2026-04-18 | PR #23213 | kitlangton | MERGED | Standardized session telemetry attributes |
Phase 1: Sprouting and Cleanup (July–August 2025)
OTEL's history in OpenCode is full of drama. The earliest attempt dates back to July 2025, when Schniz submitted PR #799 to add OTEL for performance debugging. A month later, thdxr submitted PR #1738 — taking the opposite approach, removing unused OTEL tracing code. This "add then remove" cycle foreshadowed the twists to come.
Phase 2: Starting from Scratch (September–December 2025)
PR #2735 (BrianVandenberg) attempted to add OTEL Instrumentation for the AI SDK, using an opt-in model, but received a lukewarm response. Subsequently, PR #4978 (noamzbr) was merged on December 5, adding the experimental.open_telemetry configuration option — the first OTEL PR to actually be merged.
But here's the problem: this configuration was just a toggle; it didn't initialize the OTEL SDK. As the submitter of PR #5245 (tianhuil) discovered, collaborators claimed that experimental.openTelemetry: true should work, but it didn't work out of the box. Multiple users reported the same issue, and this PR remains in OPEN status to this day.
PR #6629 (Hona / Luke Parker) was the community's most ambitious attempt: 227 commits, covering all tool calls, MCP communication, Session lifecycle, and LLM call chains. Hona demoed it at Aspire Conf in March 2026. However, it remains in Draft status to this day — perhaps because it's too large to review.
Phase 3: Pain Points Erupt (February 2026)
A series of Issues exposed the core problems with the integration:
- Issue #13438: Users configured
experimental.openTelemetry: trueper the docs, but OTLP traces were never sent - Issue #12142: Requesting OTEL export capability
- Issue #14697: Requesting native OTLP export
- Issue #14246: Hoping for OTEL support like Claude Code
The root cause was that Effect's internal Tracer was not registered as the global Provider, causing AI SDK spans to be silently discarded. Users saw the configuration option, enabled it, and got nothing.
Phase 4: Breakthrough and Merge Week (April 7–18, 2026)
On April 7, 2026, thdxr submitted PR #21387 — using Effect's OTLP layer to provide span export for the Effect service layer. Merged the same day. This was the first successfully merged production-grade OTEL PR.
Following that, kitlangton submitted and merged 5 critical PRs within a single week:
- PR #22526 — Fixed AI SDK telemetry spans export by passing the Effect OTel tracer into the AI SDK
- PR #22645 — Registered AsyncLocalStorageContextManager, fixing the critical broken span parent-child relationship bug — before the fix, every AI SDK span was an isolated trace; after the fix, 400+ spans were correctly linked under the same traceId
- PR #22653 — Added request-level route spans
- PR #23156 — Removed low-value spans from the streaming event hot path (avoiding thousands of noise spans)
- PR #23213 — Standardized session telemetry attributes (sessionID → session.id)
This week was OpenCode OTEL's "breakthrough week." From nothing to complete, from fragmented to unified, in just 12 days.
Significance
1. A Benchmark for Open-Source AI Agent Observability
OpenCode isn't the first AI tool to support OTEL (Claude Code got there first), but it's the first open-source AI Agent project to provide a complete, production-grade OTEL integration. The community can now:
- Build their own observability stack (no paid SaaS needed)
- Customize dashboards and alerts
- Embed Agent performance regression detection in CI/CD pipelines
2. The Effect-TS × OTEL Bridging Paradigm
OpenCode's technical architecture is built on Effect-TS. Effect has its own tracing system, but it's not OTEL-native. The core contribution of PR #22645 was registering the AsyncLocalStorageContextManager, allowing Effect's internal tracer and the AI SDK's OTEL tracer to share the same context — spans from both systems seamlessly fused together.
Before the fix: every AI SDK span was an isolated trace; Effect spans and AI SDK spans each operated independently.
After the fix: 400+ spans correctly linked under the same traceId, forming a complete call chain. This pattern serves as an important reference for other projects using Effect-TS.
3. The Emergence of AI Agent Semantic Conventions
Community plugins are already defining standardized metrics for AI Agents:
session.count— Session counttoken.usage— Token consumption (input/output/reasoning/cache)cost.usage— Cost tracking (USD)lines_of_code.count— Lines of code changestool.duration— Tool execution durationcache.count— Cache hit ratemodel.usage— Model usage distribution
These metrics are becoming the de facto standard for AI Agent observability, gradually aligning with OpenTelemetry's GenAI Semantic Conventions.
Technical Architecture
OpenCode's OTEL integration uses a dual-layer design:
- Effect-TS OTEL Layer: Activated by the
OTEL_EXPORTER_OTLP_ENDPOINTenvironment variable, provides span and log export for the Effect service layer - AI SDK Telemetry: Activated by the
experimental.openTelemetryconfiguration option, provides detailed spans for LLM calls (model name, token usage, streaming events, etc.)
The two layers share context via AsyncLocalStorageContextManager, enabling span parent-child relationship linking.
Key design decisions:
- Zero overhead: When no endpoint is configured, the OTEL SDK doesn't load — no runtime cost
- Batch export: Uses BatchSpanProcessor instead of Simple, ensuring performance
- Lazy loading: OTEL SDK is dynamically initialized only when environment variables are detected
- Standard protocol: Uses OTLP HTTP export, compatible with any OTLP backend
Exported Resource Attributes:
{
  "service.name": "opencode",
  "service.version": "<version>",
  "deployment.environment.name": "stable|beta|local",
  "opencode.client": "cli|desktop",
  "opencode.process_role": "main|tui|server",
  "opencode.run_id": "<uuid>"
}
How to Integrate and Use
Method 1: Native Integration (Recommended for Getting Started)
Step 1: Start an OTLP Backend
The simplest approach is using Jaeger's all-in-one Docker image:
docker run -d --name jaeger \
  -p 4318:4318 \
  -p 16686:16686 \
  jaegertracing/jaeger:latest
This provides an OTLP HTTP receiver on port 4318 and the Jaeger UI on port 16686.
Step 2: Set Environment Variables
# Required — OTEL activates automatically once set
export OTEL_EXPORTER_OTLP_ENDPOINT=http://localhost:4318

# Optional — authentication headers (for SaaS backends)
export OTEL_EXPORTER_OTLP_HEADERS="x-api-key=your-key"

# Optional — custom resource attributes
export OTEL_RESOURCE_ATTRIBUTES="host.name=my-dev-machine"
Step 3: Enable AI SDK Telemetry (Optional, Recommended)
Add the following to opencode.json:
{
  "$schema": "https://opencode.ai/config.json",
  "experimental": {
    "openTelemetry": true
  }
}
This additionally captures AI SDK-level spans: model names, token usage, streaming events, tool call parameters, etc.
Step 4: Launch OpenCode and View
opencodeOpen http://localhost:16686, select the opencode service, and you'll see the complete call chain:
SessionProcessor.create— Session creationSessionProcessor.process— Message processingLLM.run/Provider.chat— LLM calls (with token usage)Tool.run— Tool executionai.streamText— AI SDK streaming responseai.toolCall— AI SDK tool call
Method 2: Community Plugins (Recommended for Advanced Use)
The native integration provides Traces and Logs, but community plugins additionally offer structured Metrics.
@devtheops/opencode-plugin-otel — The Most Popular OTEL Plugin
{
  "$schema": "https://opencode.ai/config.json",
  "experimental": { "openTelemetry": true },
  "plugin": ["@devtheops/opencode-plugin-otel"]
}
export OPENCODE_ENABLE_TELEMETRY=1
export OPENCODE_OTLP_ENDPOINT=http://localhost:4317 # Note: gRPC portProvides rich Metrics: session.count, token.usage, cost.usage, lines_of_code.count, commit.count, tool.duration, cache.count, model.usage, retry.count, and more. Exports via OTLP/gRPC.
opencode-plugin-langfuse — Langfuse Integration
{
  "experimental": { "openTelemetry": true },
  "plugin": ["opencode-plugin-langfuse"]
}
export LANGFUSE_PUBLIC_KEY="pk-lf-..."
export LANGFUSE_SECRET_KEY="sk-lf-..."Zero-config Langfuse tracing, capturing sessions, messages, tool calls, costs, and performance data.
@gcornut/opencode-otel — The Most Configurable Plugin
Uses JSON configuration files instead of environment variables, supports gRPC, HTTP/JSON, and HTTP/protobuf protocols, and has a telemetryProfile: "claude-code" mode compatible with the Claude Code Dashboard.
pai4451/opencode-telemetry-plugin — Detailed LOC Tracking
Zero-config plugin, 80+ language detection, LOC tracking, DELTA time aggregation.
Backend Compatibility
| Backend | Endpoint | Notes |
|---|---|---|
| Jaeger | http://localhost:4318 | Top choice for local development |
| Grafana Tempo | http://localhost:4318 | Pair with Grafana Dashboard |
| SigNoz | https://ingest.us.signoz.cloud:443 | Open-source APM, official tutorial |
| Honeycomb | https://api.honeycomb.io | SaaS, requires API Key |
| Datadog | https://api.datadoghq.com | Via OTLP ingest |
| .NET Aspire Dashboard | http://localhost:18889 | PR #6629 was specifically designed for this |
| Langfuse | Via dedicated plugin | Direct SDK integration |
⚠️ Common Pitfalls
experimental.openTelemetry: truealone is not enough — it only enables AI SDK span generation. You also need to setOTEL_EXPORTER_OTLP_ENDPOINT(for native export) or install a plugin that initializes the NodeSDK.- The native layer uses OTLP HTTP (port 4318), while
@devtheops/opencode-plugin-oteluses OTLP gRPC (port 4317). Both can run simultaneously without interfering with each other. - The project is still iterating rapidly — Issue #14697 requests making endpoint/protocol/headers top-level config instead of environment variables, which hasn't been merged yet.
Real-World Results: My Grafana Dashboard
After all this, you might be wondering: what can you actually see after integrating? I hooked it up to my own Grafana + Tempo stack, and here's what I actually saw.
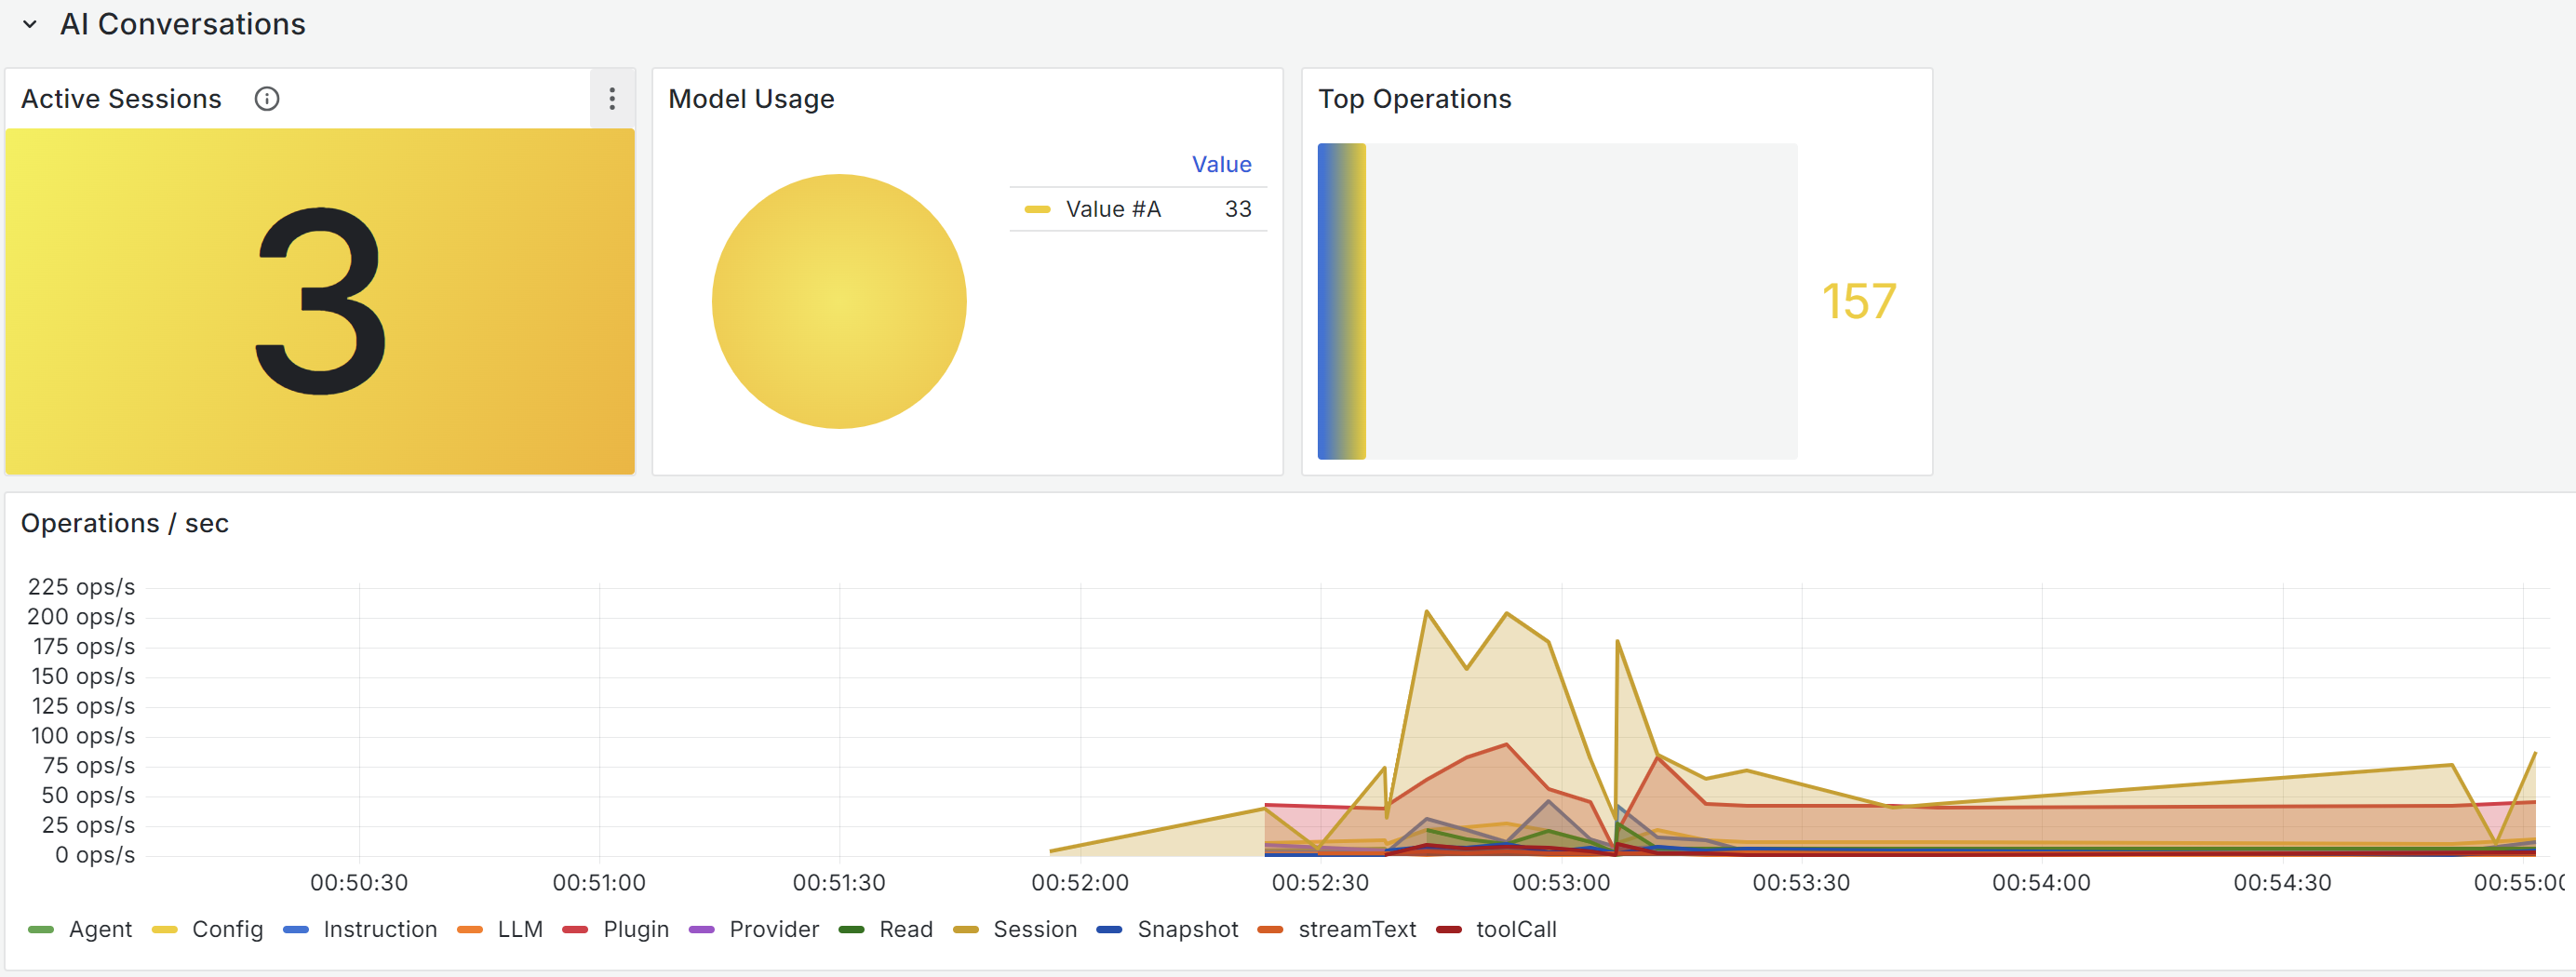
Model Operations Overview
This was the first surprise after connecting OTEL — you can finally see what the Agent is "doing." Three core metrics are clear at a glance: Active Sessions, Model Usage, and Top Operations. The Operations/sec time series chart below breaks down by operation type (Agent, LLM, Plugin, Provider, Session, streamText, toolCall) in a stacked view — which component consumes the most resources at any given time is crystal clear.
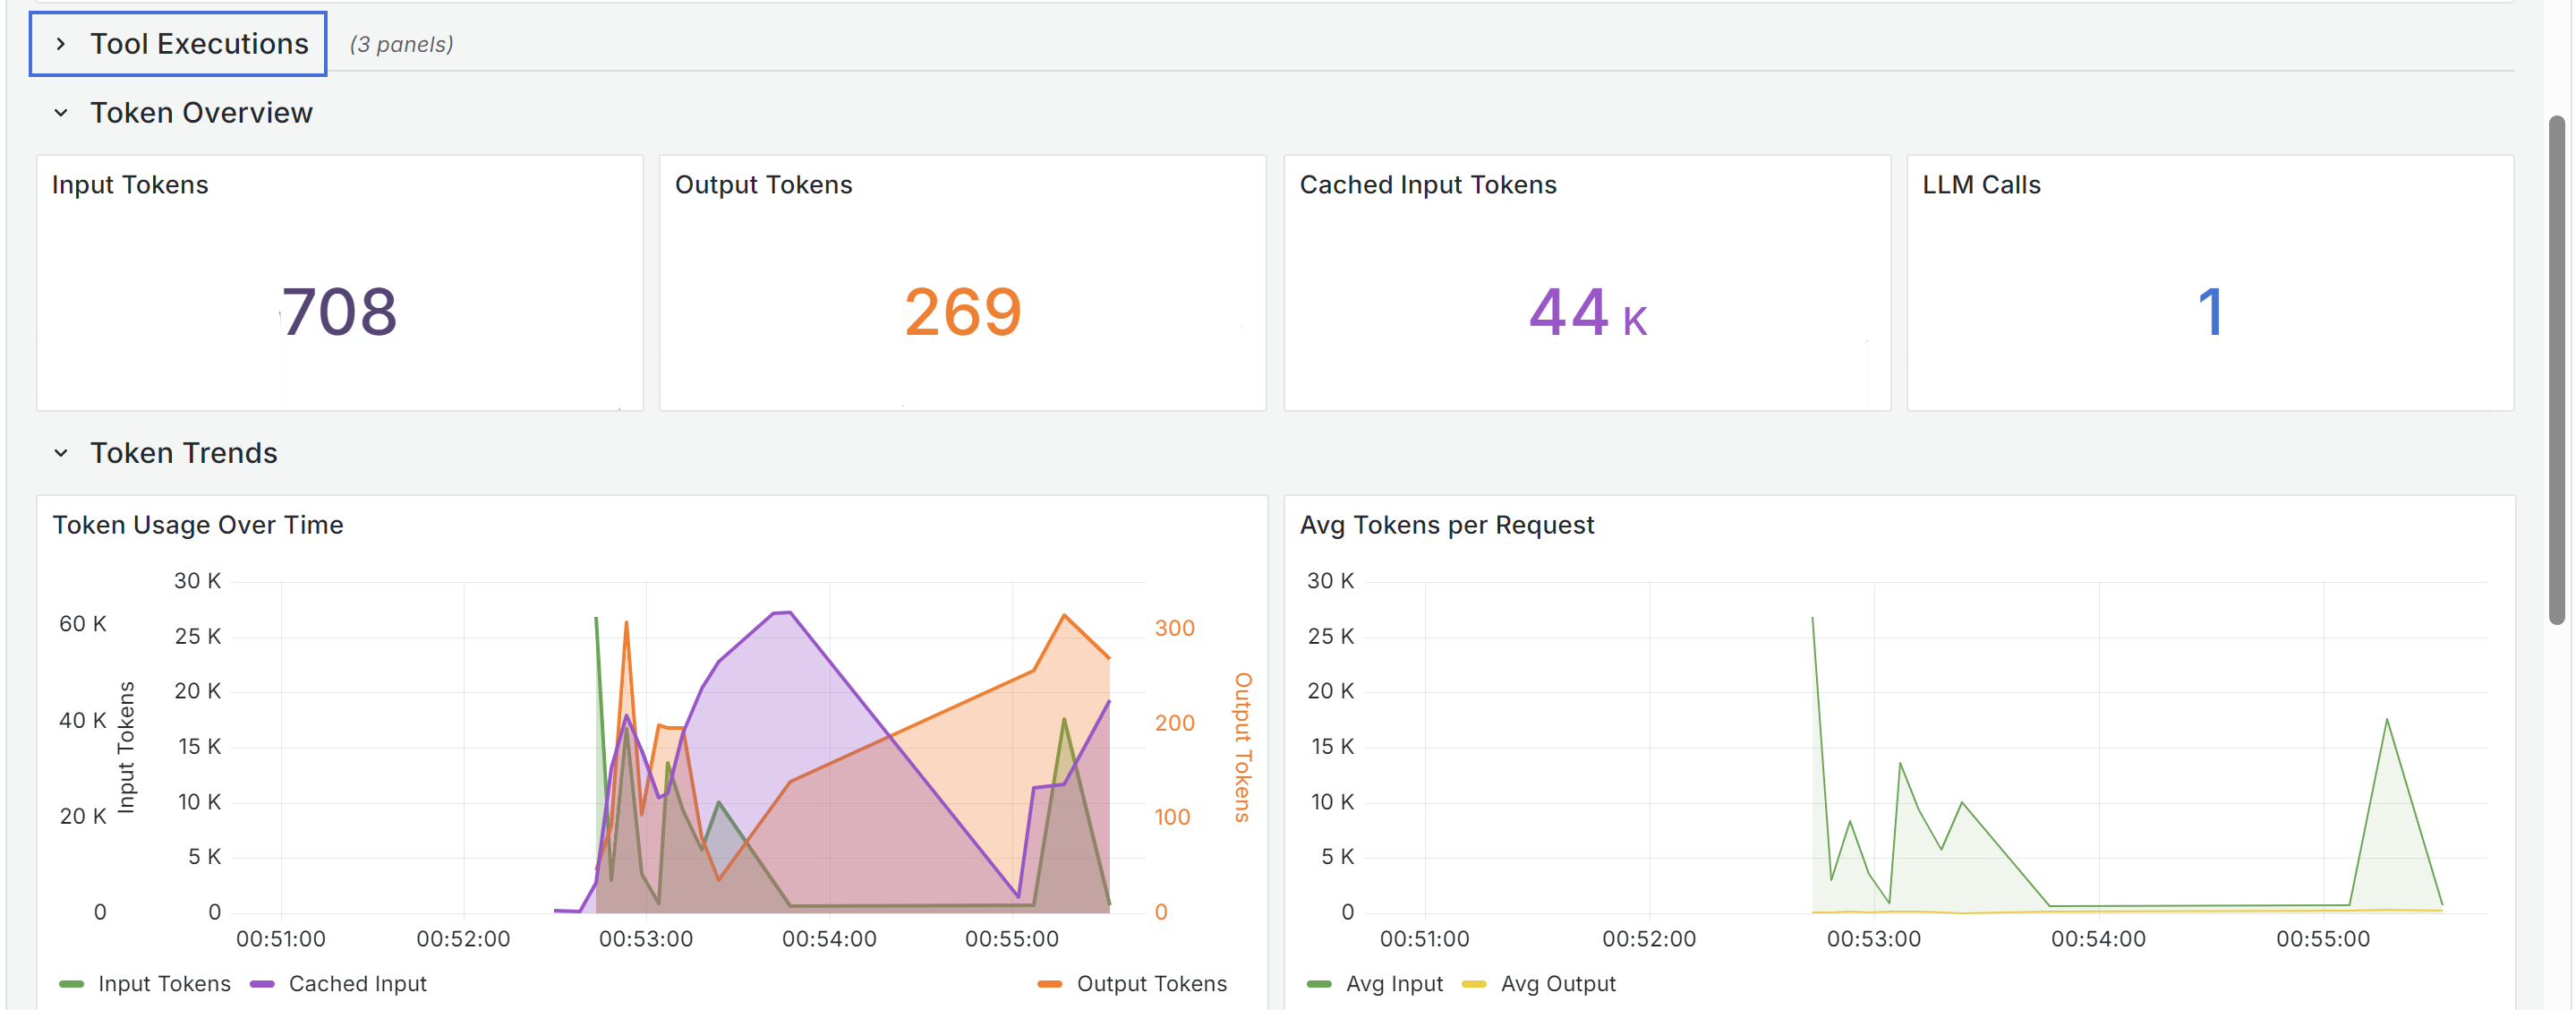
Token Consumption Distribution
This one is even more practical. Input Tokens, Output Tokens, and Cached Input Tokens are laid out clearly. You can see the cache at work — 44k Cached Input vs 708 actual Input, a 98.5% cache hit rate. The Token Trends chart lets you track token consumption trends per request, comparing peaks and valleys.
Output Rate and Session Analysis
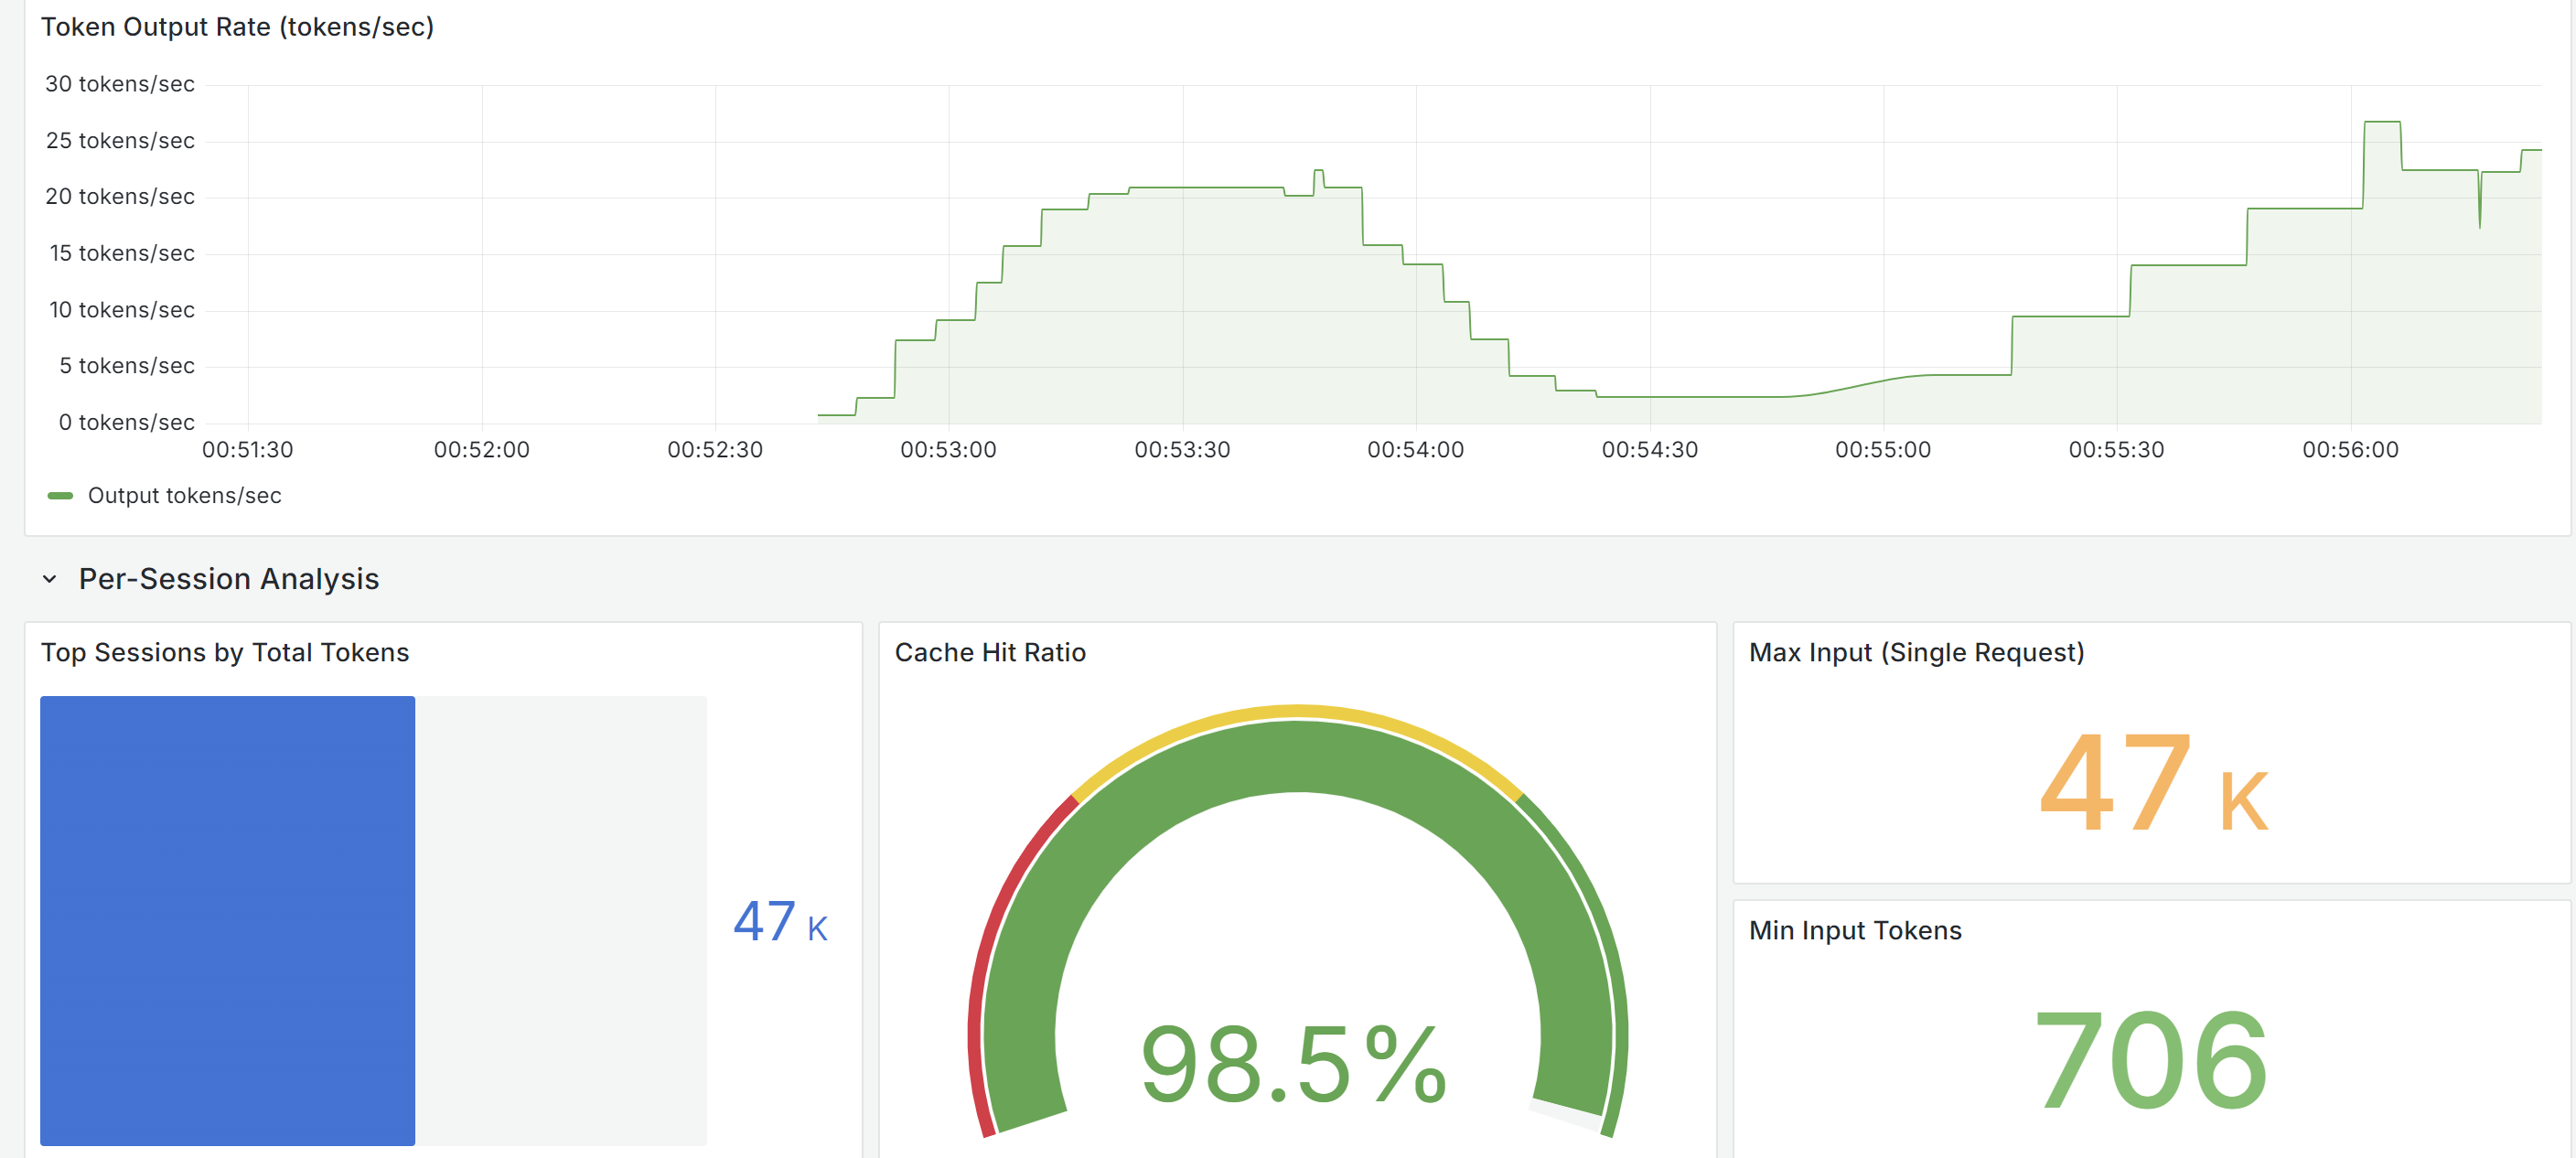
This is the one that impressed me the most. The Output Token Rate curve vividly illustrates the Agent's "thinking speed" — a peak of 27 tokens/sec, not uniform but pulsating. The Cache Hit Ratio in the Per-Session Analysis reached 98.5%, showing that most of the Prompt Context was served from cache, which is why the actual token cost was far lower than the theoretical value. Max Input 47k tokens, Min Input 706 tokens — revealing the enormous variance between requests.
All three screenshots above were captured during a normal OpenCode coding session. Configuration took only 5 minutes — set one environment variable, start Grafana + Tempo, launch OpenCode, and the data flows in. That's the value of OTEL: you don't have to guess anymore.
Closing Thoughts
Looking back at this journey, it has a certain dramatic quality: in July 2025 someone added OTEL, and in August it was deleted; the community submitted proposals repeatedly, the largest one (227 commits) is still in Draft status; users configured everything per the docs but couldn't see any traces — between Effect's internal tracer and OTEL's global provider, there was a missing bridge.
The way it was ultimately resolved was actually the most straightforward: not a big-bang approach, but filling in the gaps piece by piece. PR #21387 first connected the Effect layer's export, then PR #22645 registered the context manager to link up the AI SDK's spans, and then gradually polished the details. This iterative, small-steps approach proved far more effective than pursuing a perfect solution from the start.
For the OpenCode community, OTEL is more than just a technical feature. It means AI Agents are moving from "usable" to "trustworthy" — when you can see every step the Agent takes on a dashboard, the complete chain of every LLM call, and every cent of cost consumption, the black box is no longer a black box.
If you're using OpenCode, spend 5 minutes configuring OTEL. When you see the Agent's complete call chain, token consumption curves, and cache hit rates in Grafana or Jaeger for the first time, you'll feel that these 10 months of waiting were worth it.
Login to Comment
You need to log in to leave a comment.
Login